FreeBSD Kernel Debugging using WorkStation
11 Mar 2023Hello.
For our second post, let’s talk about using VMWare workstation (on Windows 10) to enable kernel debugging. Specifically, FreeBSD kernel debugging. Let me state that this applies to v10 of FreeBSD. Things change in the kernel and v10 is a rather old one compared to the current version 13. However this should give us enough hints to navigate the current landscape if need be.
Since I cannot install fbsd natively, I resorted to using two VMs with VMware workstation. Let’s call the VM hosting the debugger the server (also called the development or ‘dev’ VM), the one being debugged the client (also referred to as the ‘target’ VM).
To that end, I added a named pipe as serial port on both the VMs, with one end on the server and the other one on the client. Depending on your host OS, the location of the pipe will differ. If like me you’re on windows, the most typical location would be something like \\.pipe\com_1.
On the server VM, configure the pipe like so.
| 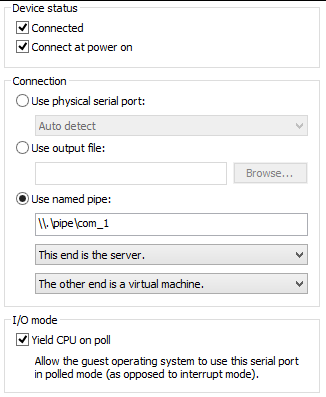 |
|
On the client VM, configure the pipe like so:
| 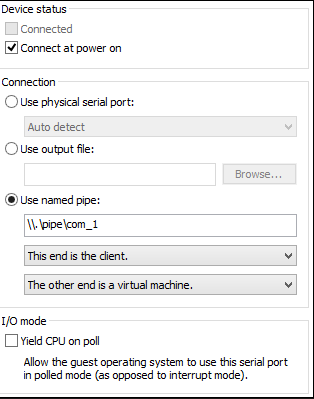 |
|
Make sure to not yield the CPU on the client VM. Having setup the named pipe connection between these VMs, we need to make sure that they are actually connected with this named pipe. To test that, we use serial interface programs on these VMs to send each other small messages. Now fbsd, unlike Linux, has two serial interfaces for each physical serial port, a “dial-out” interface and a “dial-in” interface. Assuming that the kernel maps the very first serial line to our named pipe, the dial-out device is /dev/cuau0 and the dial-in device is the familiar /dev/ttyu0.
Now let’s fire up our VMs and check if these VMs are indeed connected via the serial port. I used the cu utility to check this. On the client, use cu to connect to cuau0 like so: sudo cu -l /dev/cuau0 -s 9600 (baud rate of 9600). It will say “connected”. Similarly on the server, connect to ttyu0 like so: sudo cu -l /dev/ttyu0 -s 9600 which will again say “connected”. Then type characters on either of them. They will appear on the other end. Note that they will NOT be echoed so you won’t see them on the originating end. Make sure you do this with ‘sudo’ or else it won’t be able to create a ‘lock’ file under /var/spool/lock without which it won’t connect.
Once having verified that they are indeed connected, we can prepare the kernel on the target (the debugged VM) to add debugging options to it. You may always refer to the handbook to understand the process of configuring and then compiling the kernel. Here are the various options related to debugging.
So here’s what my config file looks like:
include GENERIC
ident 'some-string-to-identify-your-kernel'

# -- added some debug options
options     DDB
options     GDB
options     BREAK_TO_DEBUGGER
So here I include the factory default GENERIC kernel and only modify stuff that I need to modify thereby always referring other options back to the original one. ident allows us to give a ‘name’ to our kernel which we’ll use later to identify the running kernel. This conf file lives in my home directory.
Now we cd to the conf directory of the underlying architecture which, in my case is /usr/src/sys/amd64/conf. We soft-link the above file here. And we go back to /usr/src/ and start the compilation (make sure you are root).
cd /usr/src/
make -j4 (for single CPU) buildkernel -DKERNFAST (if re-compiling) KERNCONF=`name-of-the-conf-file`
It took around 20 mins on my VM to which I had given 256 MB ram, pretty decent IMHO. Now we need to install this kernel at the ‘right’ place for it to be picked up by the bootloader. The default kernel image picked up the bootloader is /boot/kernel/kernel. So just to be on the safe side, we need to make sure the “working” kernel need to be copied somewhere persistent.
cp /boot/kernel/kernel ~/kernel.original followed by cd /usr/src/ && sudo make installkernel KERNCONF=$($name-of-the-conf-file) | tee ~/installkernel.log
The object files generated by the build are stored inside /usr/obj/usr/src/sys. To know more about the build structure please read build(7). To learn more about the various make options, read make(1) and make.conf(5). In order to have GDB debug macros work for KGDB remote debugging, one has to ‘install’ them in the same directory containing the kernel binaries (aka the object files).
So
cd /usr/obj/usr/src/sys/AIJAZ-DEBUG/
sudo make gdbinit
One can now copy the kernel (called kernel.debug) and the symbol file (called kernel.symbols) over to the development VM, but if one is intending to debug KLD modules as well, preferable to copy the entire directory over to the dev VM. Also while building the kernel module, remember to pass the debug flag while compiling and installing:
Thusly,
make DEBUG_FLAGS=-g3
make install DEBUG_FLAGS=-g3
Or if you already have the exact same source on both the target VM as well as the dev VM, you could repeat the same steps on the dev VM as well. Now reboot the client VM.
Before you try to reboot make sure that the UART flags is “0x9” plus you need to set the baud rate to 9600 (default). You do it by changing ‘/boot/device.hints’ (read more about it at uart(4)). You want your UART to be able to participate in remote kernel debugging. I typically set it to 0x10 | 0x80 i.e. hint.uart.0.flags=”0x90” . This is a VERY IMPORTANT STEP. You won’t be able to connect via client KGDB instance to the server GDB stub without this. After having done that, reboot the server.
If you want boot messages to be shown on the console, you also need to do:
echo 'console="comconsole"' >> /boot/loader.conf
Remember, due to the serial nature of the console, boot messages might end up being garbled by the time the console shows it, so you can change the baud rate accordingly. Now you are ready to reboot your server VM. After rebooting,you will see the menu like so:
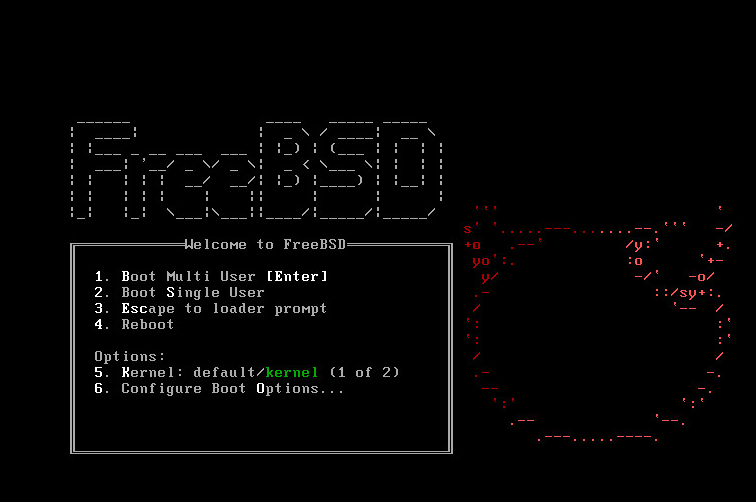
If we wish to debug the client boot up process, we need
Press 3 to see the loader prompt. At the loader prompt, type boot -d. If all goes well, you should see this:
| 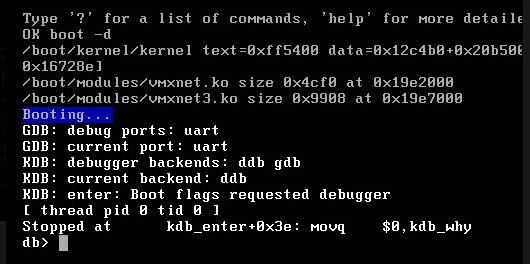 |
|
This is the DDB prompt, an online kernel debugger with limited capabilities. At this time, If GDB debug ports says NULL or not connected, it is mostly because one may have forgotten to change the UART flags, which as we showed above, should be 0x8 or above.
Assuming we are fine until this point, go to the client machine and browse to the directory which has the debug version of the kernel (kernel.debug). Attach KGDB to this image (remember to be root) like so: sudo kgdb kernel.debug followed by setting the baud rate like so set remotebaud 9600.
After that, go back to the debug prompt on the server and type gdb, The stub is now listening for the remote end to be connected.
Now go back to the client and type target remote /dev/cuau0. Finally these VMs are connected via the named pipe. On the client end, you can see the portion where the server VM is blocked. In my case, this is what I see:
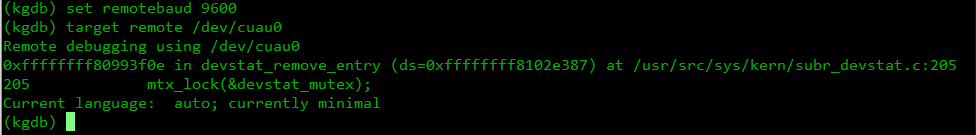
As we can see, execution stopped in the function devstat_remove_entry in /usr/src/sys/kern/subr_devstat.c:205. The ‘205’ at the end shows the line number. The GDB ‘bt’ command gives us the backtrace, which in my case is:
(kgdb) bt
#0  0xffffffff80993f0e in devstat_remove_entry (ds=0xffffffff8102e387) at /usr/src/sys/kern/subr_devstat.c:205
#1  0xffffffff80d52b26 in fpugetregs (td=<value optimized out>) at /usr/src/sys/amd64/amd64/fpu.c:721
#2  0xffffffff802e19e4 in btext () at /usr/src/sys/amd64/amd64/locore.S:79
#3  0x0000000000000000 in ?? ()
As we can see we are still in the very early stages of booting. ‘Early’ here is a relative word, as we are already way past the earlier three-staged bootloader. locore.S is part of very early boot code that gets executed when the processor starts. As you can see it’s in assembly for very fine grained control. If one is not interested in the machine and board level initialization details, then one can issue step over or s on the gdb prompt until one sees routines from the architecture independent part of the codebase.
I, for now, issue a c and let the target VM complete initialization. We can see the classic login prompt black screen (assuming you haven’t installed any window manager like Gnome or KDE). The target is now in control. In order to get back to the debugger, we need to put the target back into the debugged mode like so: sudo sysctl debug.kdb.enter=1. This will lock the target VM and return control to the gdb connection on the dev VM. At times, panicking the client will switch the debugger into DDB (rather than gdb). If that happens, issue the following command on the DDB prompt like so:
db>gdb
From the KGDB prompt, issue the kldstat command:
(kgdb) kldstat
During symbol reading, Incomplete CFI data; unspecified registers at 0xffffffff8099497a.
Id Refs Address    Size     Name
 1    6 0x80200000 17e10c8  kernel
 2    1 0x819e2000 4cf0     vmxnet.ko
 3    1 0x81c11000 23dc     vmmemctl.ko
Issuing a c will release control of the target VM. To emphasize, if the target VM panics for any reason, the control is passed to the server VM. If we wish to panic it manually, we issue the sudo sysctl debug.kdb.enter=1 command on it. So this completes our basic debugging setup for FreeBSD.